 |
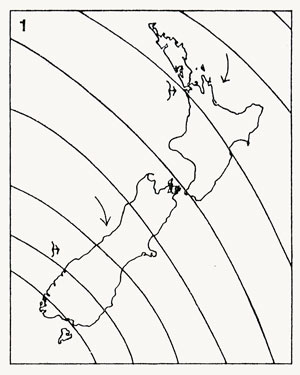
In diagram 1 the centre of a weather system is about 800 miles (1,287 kilometres) WSW of New Zealand. A cloud bank looms offshore of the West Coast, and a heavy swell rolls in from the west. |
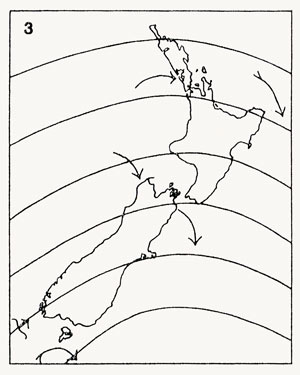 |
Diagram 3 shows SW winds and clearing on the West Coast. There is NW rain in the north, and dry NW winds on the east coast of the South Island, succeeded by a ‘southerly bu’ster’ with rain or snow according to season. |
In order to provide cheap, simple daily weather information to the press, in 1882 the meteorological office prepared 24 typical isobaric diagrams of New Zealand, based on three years’ analysis of weather patterns. Copies were supplied to the leading newspapers. Each day the office cited a diagram number, indicating to the newspaper which one was to be published, and added a descriptive note.
Using this item
Te Ara – The Encyclopedia of New Zealand
This item has been provided for private study purposes (such as school projects, family and local history research) and any published reproduction (print or electronic) may infringe copyright law. It is the responsibility of the user of any material to obtain clearance from the copyright holder.