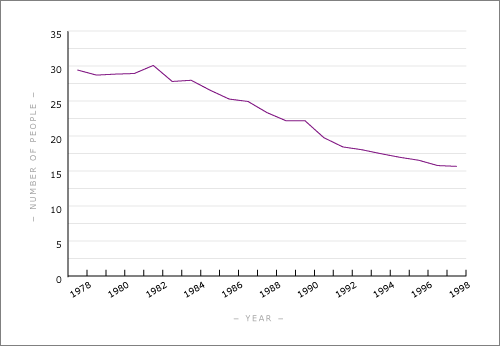
One of the most telling changes in New Zealand society was the drop in the popularity of marriage between the 1970s and 1990s. Those who did still get married were leaving it until later in life. Over the same period, the number of marriages ending in divorce also rose. This graph uses the general marriage rate – the numbers getting married each year per 1,000 mean unmarried population aged 16 years and over.
Using this item
Te Ara - The Encyclopedia of New Zealand
This item has been provided for private study purposes (such as school projects, family and local history research) and any published reproduction (print or electronic) may infringe copyright law. It is the responsibility of the user of any material to obtain clearance from the copyright holder.
Source: New Zealand Official Yearbook, 1980–2001


Add new comment