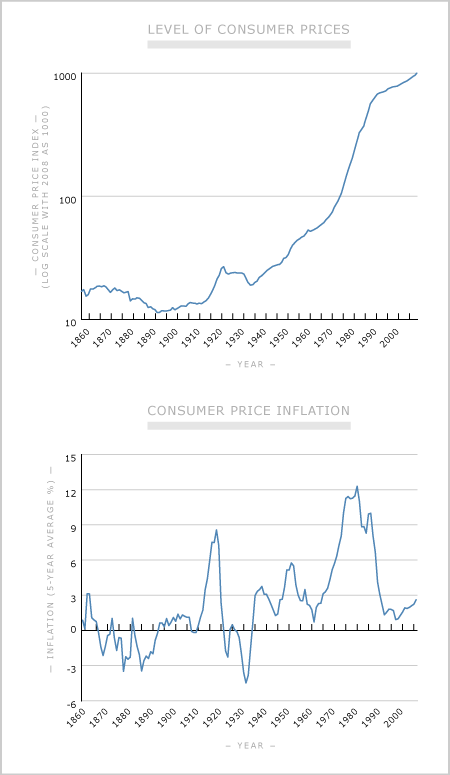
A consumer price index (CPI), which enables price comparisons over time, is available back to 1857, but figures before 1915 are not very reliable. The level of the CPI over time is on the top graph, which has a ‘log’ (or ratio) scale – equal vertical distances represent equal proportional increases.
For some purposes the change in prices or rate of inflation is more relevant. This is indicated in the bottom graph as the average increases in prices over a five-year period (smoothing out year-to-year fluctuations).
Consumer prices have increased by about 60 times in the last 150 years, an average growth rate of about 2.7% a year. There were two periods of deflation (falling prices). Following the gold and war booms of the 1860s, prices fell until the early 1890s, as international prices and shipping costs decreased. The other period of deflation was during the 1920s stagnation, and especially the great depression of the early 1930s.
There was strong inflation during the First World War (7.2% per annum), and price increases were temporarily in excess of 5% per annum in the early 1950s, partly from the international inflation of the Korean War boom. However
Using this item
Te Ara - The Encyclopedia of New Zealand

This item is licensed under a Creative Commons Attribution-NonCommercial 3.0 New Zealand Licence
Source: Statistics New Zealand


Add new comment