


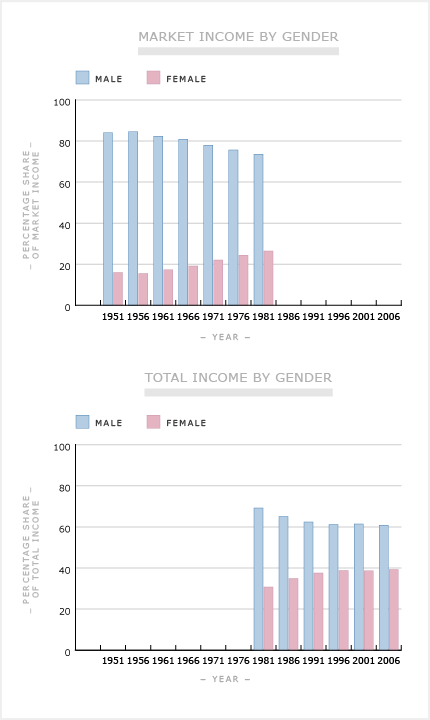
These graphs suggest that in the half-century after 1951 the incomes of men and women became more equal in New Zealand. The figures in the top graph, for 1951 to 1981, are based on market incomes, and do not include taxes or government transfer payments such as benefits. The figures in the bottom graph, from 1981 to 2006, include the transfer payments but not the effect of taxes. The changes in large part reflect the increase in the number of women, especially married women, in the paid workforce.
Te whakamahi i tēnei tūemi
Te Ara - The Encyclopedia of New Zealand

This item is licensed under a Creative Commons Attribution-NonCommercial 3.0 New Zealand Licence
Source: New Zealand census

Tāpiritia te tākupu hou